pie_chart
Description
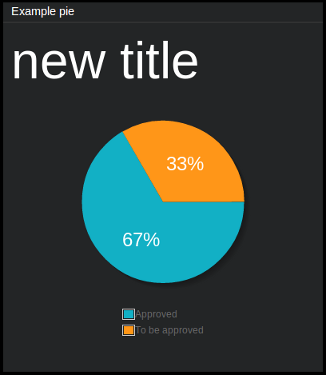
“Pie-chart” style chart using jqPlot library, with optional legend.
Content
data = {
    "title": "<optional_title>",
    "pie_data": [[identifier1, value1], [identifier2, value2], ...]
}
where:
- title
Chart’s title (optional).
- pie_data
Data for pie-chart in a form of list of lists, where each sub-list is an identifier-value pair. Percentage of the whole chart shared by given part is calculated automatically by jqPlot - relatively to the sum of values of all parts.
Example:
curl http//localhost:7272/api/v0.1/<api_key>/push
     -X POST
     -d "tile=pie_chart"
     -d "key=example_pie"
     -d 'data={"title": "My title", "pie_data": [["Pie 1", 25], ["Pie 2", 25], ["Pie 3", 50]]}'
– this will result in a pie-chart with title “My title”, divided by three parts “Pie 1”, “Pie 2” and “Pie 3”.
Configuration
value = {<jqplot_config>}
where:
- jqplot_config
Configuration params in the form described by jqPlot documentation.
Example:
curl http://localhost:7272/api/v0.1/<api_key>/tileconfig/<tild_id>
     -X POST
     -d 'value={"title": true, "legend": {"show": true, "location": "s"}}'
– this will result in a pie-chart with legend turned on at the bottom of the tile (s stands for “south”) - its title will be turned on as well.