norm_chart
New in version 1.3.0.
Description
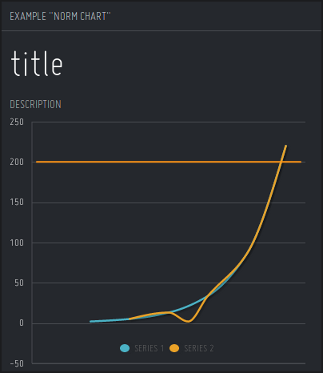
“Curve vs norm” style chart. Suitable for situations, when you want to compare some data with expected value (“norm”) or put an emphasis on y-axis values.
Content
"data" = {
    "title": "<title>",
    "description": "<description>",
    "plot_data": [ [<series1>], [<series2>], [<series3>], ... ]
}
where:
- title, description
Title and description (subtitle) for the tile.
- plot_data
Data for charts in a form of list of series, where each series designates single chart; each element of a given series is a pair [x_axis_value, y_axis_value].
Example:
curl http://localhost:7272/api/v0.1/<api_key>/push
     -X POST
     -d "tile=norm_chart"
     -d "key=<tile_id>"
     -d 'data={"title": "My title",
               "description": "Some description",
               "plot_data": [[[1, 2], [3, 5.12], [5, 13.1], [7, 33.6], [9, 85.9], [11, 219.9]],
                             [[6, 2], [3, 5.12], [5, 13.1], [7, 33.6], [9, 85.9], [11, 219.9]]]}'
Configuration
value = {
    "easyNorms": [["<color>", <y-value>, <line_width>], ...]
}
where:
- easyNorms
List of norms to be displayed. Each norm consists of three elements:
- color
Color which given norm should use - in a hexadecimal form or color name (e.g. #94C140 or green).
- y-value
Value for the norm.
- line_width
Line thickness for the norm (in pixels).
Example:
curl http://localhost:7272/api/v0.1/<api_key>/tileconfig/<tile_id>
     -X POST
     -d 'value={"easyNorms": [["yellow", 200, 2], ["green", 100, 2]]}'