advanced_plot
Description
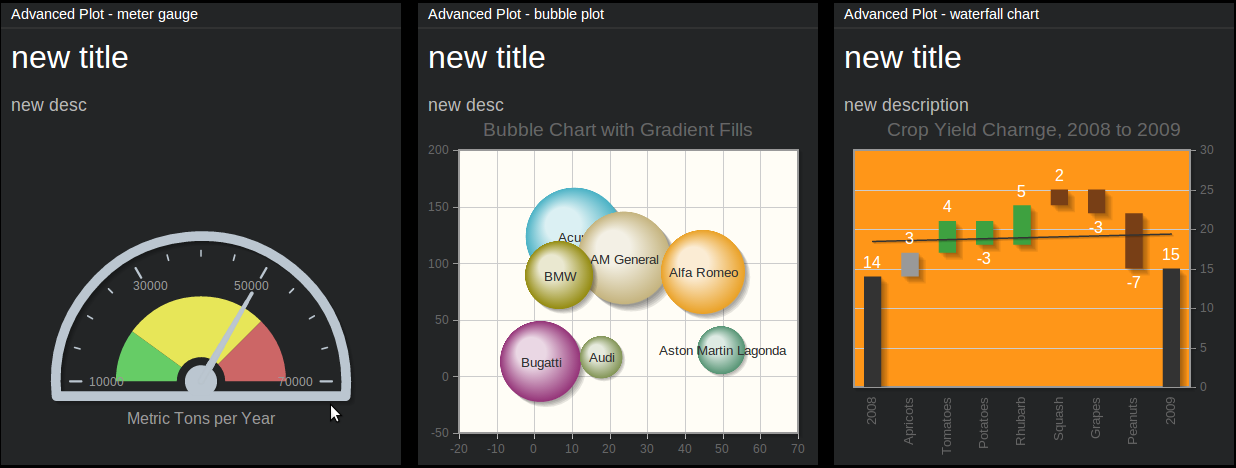
This tile is for more demanding users. It basically allows to display arbitrary type of chart/plot from the jqPlot library, along with the title and description (both are optional).
Before you start experimenting with jqPlot library, we suggest to familiarize yourself with this manual. After that you should check out options tutorial and options summary.
Here you will find some examples.
Content
"data" = {
    "title": "<tile>",
    "description": "<description>",
    "plotData": "<data>"
}
where:
- title, description
Title and description (subtitle) for the tile.
- plotData
Data that will be fed directly to your plot. Its form depends on the specific type of plot that you are going to use - see jqPlot’s documentation for the details.
Example (using horizontal Bar Chart - third example from the top):
curl http://localhost:7272/api/v0.1/<api_key>/push
     -X POST
     -d "tile=advanced_plot"
     -d "key=<tile_id>"
     -d 'data={"title": "Metric Tons per Year", "description": "",
               "plotData": [[[2,1], [4,2], [6,3], [3,4]],
                             [[5,1], [1,2], [3,3], [4,4]],
                             [[4,1], [7,2], [1,3], [2,4]]]}'
Note
Keep in mind that advanced_plot can display arbitrary charts from jqPlot library, and more than often they are quite different when it comes to the parameters required etc.
Configuration
value = {
  "value": "<jqplot_config>"
}
where:
- value
Raw configuration that will be passed directly to jqPlot and which should obey the rules defined by the jqPlot library. Internally, this config will be passed as $.jqplot(some-container, some-data, our-config).
If such configuration contains one of jqPlot’s renderers, its name should be passed as a string, according to the table below:
jqPlot’s renderer string to send $.jqplot.BarRenderer "BarRenderer" $.jqplot.BlockRenderer "BlockRenderer" $.jqplot.BubbleRenderer "BubbleRenderer" $.jqplot.CanvasAxisLabelRenderer "CanvasAxisLabelRenderer" $.jqplot.CanvasAxisTickRenderer "CanvasAxisTickRenderer" $.jqplot.CanvasTextRenderer "CanvasTextRenderer" $.jqplot.CategoryAxisRenderer "CategoryAxisRenderer" $.jqplot.DateAxisRenderer "DateAxisRenderer" $.jqplot.DonutRenderer "DonutRenderer" $.jqplot.EnhancedLegendRenderer "EnhancedLegendRenderer" $.jqplot.FunnelRenderer "FunnelRenderer" $.jqplot.LogAxisRenderer "LogAxisRenderer" $.jqplot.MekkoAxisRenderer "MekkoAxisRenderer" $.jqplot.MekkoRenderer "MekkoRenderer" $.jqplot.MeterGaugeRenderer "MeterGaugeRenderer" $.jqplot.OhlcRenderer "OhlcRenderer" $.jqplot.PieRenderer "PieRenderer" $.jqplot.PyramidAxisRenderer "PyramidAxisRenderer" $.jqplot.PyramidGridRenderer "PyramidGridRenderer" $.jqplot.PyramidRenderer "PyramidRenderer"
Example (using horizontal Bar Chart - third example from the top):
curl http://localhost:7272/api/v0.1/<api_key>/tileconfig/<tile_id>
     -X POST
     -d 'value={
            "seriesDefaults": {
                "trendline": {"show": false},
                "renderer":"BarRenderer",
                "pointLabels": {"show": true, "location": "e", "edgeTolerance": -15},
                "shadowAngle": 135,
                "rendererOptions": {"barDirection": "horizontal"}
            },
            "axes": {"yaxis": { "renderer": "CategoryAxisRenderer"}}}'