line_chart
Description
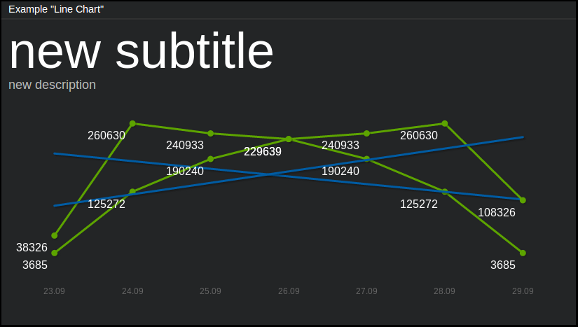
Line-chart using jqPlot library. Allows to display arbitrary number of plots on single chart, with automatic generation of trend lines for them (which is turned on by default).
Content
data = {
    "subtitle": "<subtitle_text">,
    "description": "<description_text>",
    "series_list": [[<series1>], [<series2>], [<series3>], ...]
}
where:
- subtitle, description
Additional text fields for charts descriptions (optional - you can pass empty strings here).
- series_list
Data for line-charts in a form of list of series, where each series designates single chart; each element of a given series is a pair [x_axis_value, y_axis_value].
Example:
curl http://localhost:7272/api/v0.1/<api_key>/push
     -X POST
     -d "tile=line_chart"
     -d "key=example_line"
     -d 'data={"subtitle": "averages from last week",
               "description": "Sales in our dept",
               "series_list": [[["23.09", 8326], ["24.09", 260630], ["25.09", 240933], ["26.09", 229639], ["27.09", 190240], ["28.09", 125272], ["29.09", 3685]],
                               [["23.09", 3685], ["24.09", 125272], ["25.09", 190240], ["26.09", 229639], ["27.09", 240933], ["28.09", 260630], ["29.09", 108326]]]}'
– this will give two plots on a single chart (on x-axis there will be “23.09”, “24.09”, “25.09” and so on) with heading “Sales in our dept” and subtitle “averages from last week”.
Configuration
value = {<jqplot_config>, simplify: <simplify_config>}
where:
- jqplot_config
Configuration params in the form described by jqPlot documentation.
Example:
curl http://localhost:7272/api/v0.1/<api_key>/tileconfig/example_line
     -X POST
     -d 'value={"grid": {"drawGridLines": true,
                         "gridLineColor": "#FFFFFF",
                         "shadow": false,
                         "background": "#000000",
                         "borderWidth": 0}}'
– this will set up the grid (in white color), black background and will turn off shadow effects as well as borders.
simplify_config
simplify_config = {
    tolerancy: 10,
    data_points_limit: 50, // we will TRY to achieve lower number of data points than this
    max_simplifying_steps: 5,
    simplify_step_multiplicator: 1.5
    };
Each option is self-describing. This feature tries to optimize dataset to achieve points count lower than data_points_limit. If simplify_config is not set, there won’t be any simplify process at all (you will just have your raw data displayed).
curl -X POST http://127.0.0.1:7272/api/v0.1/dev_key/tileconfig/test_line
     -d 'value={"simplify": {"tolerancy": 2}}'
Note
In case of displaying multiple plots on a single chart (e.g. for more than one data series) you have to keep in mind that the x_axis_value values should be the same for all of those plots.