cumulative_flow
Description
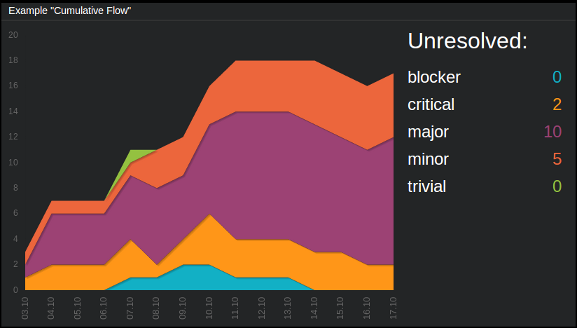
Cumulative chart using jqPlot library. Allows to display up to seven plots on a single chart.
Content
data = {
    "title": "<title>",
    "series_list": [{"label": "<label1>", "series": [<val1>, <val2>, ...]},
                    {"label": "<label2>", "series": [<val1>, <val2>, ...]}]
}
where:
- title
Title to be displayed above the labels.
- series_list
A container (i.e. list of objects) for the data; each such object corresponding to a single plot consists of two keys: label and series, where the latter is a list of values constructing the plot.
Example:
curl http://localhost:7272/api/v0.1/<api_key>/push
     -X POST
     -d "tile=cumulative_flow"
     -d "key=<tile_id>"
     -d 'data={"title": "My title:",
               "series_list": [{"label": "label 1", "series": [ 0, 0, 0, 0, 1, 1, 2, 2, 1, 1, 1, 0, 0, 2, 0 ]},
                               {"label": "label 2", "series": [ 0, 5, 0, 0, 1, 0, 0, 3, 0, 0, 0, 7, 8, 9, 1 ]}]}'
Configuration
value = {"ticks": [[<key>, "<value>"], [<key>, "<value>"], ... ]}
where:
- ticks
List of elements defining x-axis; each such element is a list of form [k, v] where k is an oridinal number designating position of such tick and v is a string which will be displayed in that place.
Example:
curl http://localhost:7272/api/v0.1/<api_key>/tileconfig/<tile_id>
    -X POST
    -d 'value={"ticks": [[1, "mon"], [2, "tue"], [3, "wed"], [4, "thu"], [5, "fri"], [6, "sat"], [7, "sun"]]}'
Note
If series_list contains more than one object (which is the case 99% of the time), each one of them should have series list of the same length - and this lenght should be equal to the number of ticks.