bar_chart
Description
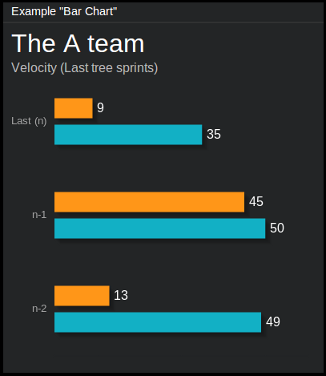
Tile displaying data in the form of horizontal bar charts. Each cart may consist of one or more series of data - in the latter case, such bars are grouped respectively. There are no “hard” limits when it comes to the number of charts/series, although we suggest to keep them down to 3 charts of 2 series each.
Content
data = {
    "title": "<title>",
    "subtitle": "<subtitle>",
    "ticks": ["<label1>", "<label2>", "<label3>" ...],
    "series_list": [[<val1>, <val2>, <val3>, ...],
                    [<val1>, <val2>, <val3>, ...]]
}
where:
- title, subtitle
Title and subtitle displayed on the top of the tile.
- ticks
Labels to be displayed on the left side of the charts.
- series_list
List of series, as name suggests. [[1, 2]] will give one chart of two bars, [[3, 4, 5], [6, 7, 8]] will give two charts of three bars each.
Example:
curl http://localhost:7272/api/v0.1/<api_key>/push
     -X POST
     -d "tile=bar_chart"
     -d "key=<tile_id>"
     -d 'data={"title": "The A-Team",
               "subtitle": "Velocity (Last tree sprints)",
               "ticks": ["n-2", "n-1", "Last (n)"],
               "series_list": [[49, 50, 35], [13, 45, 9]]}'
Configuration
This tile does not offer any configuration options.
Note
In case of displaying more than one charts on the same tile, the number of values in series_list for every chart should be the same (and they should be equal to the number of ticks.